UX Insights
Moveo One transforms raw behavioral data into meaningful UX insights — helping you identify friction, confusion, and drop-off points in your product experience.
Unlike traditional analytics tools that rely on manual tagging, Moveo One automatically analyzes patterns of interaction, attention, and motion to uncover usability issues.
Overview
UX insights are generated by combining:
- Event patterns (e.g., repeated clicks, abandoned forms)
- Temporal behavior (e.g., dwell time, hesitation)
- Motion and navigation flow (e.g., scroll dynamics, gesture velocity)
- Predictive modeling (e.g., churn risk, decision hesitation)
These insights allow you to answer questions like:
- Where do users hesitate before completing a purchase?
- Which screens cause cognitive overload?
- What actions predict drop-off or frustration?
Example Insight Output
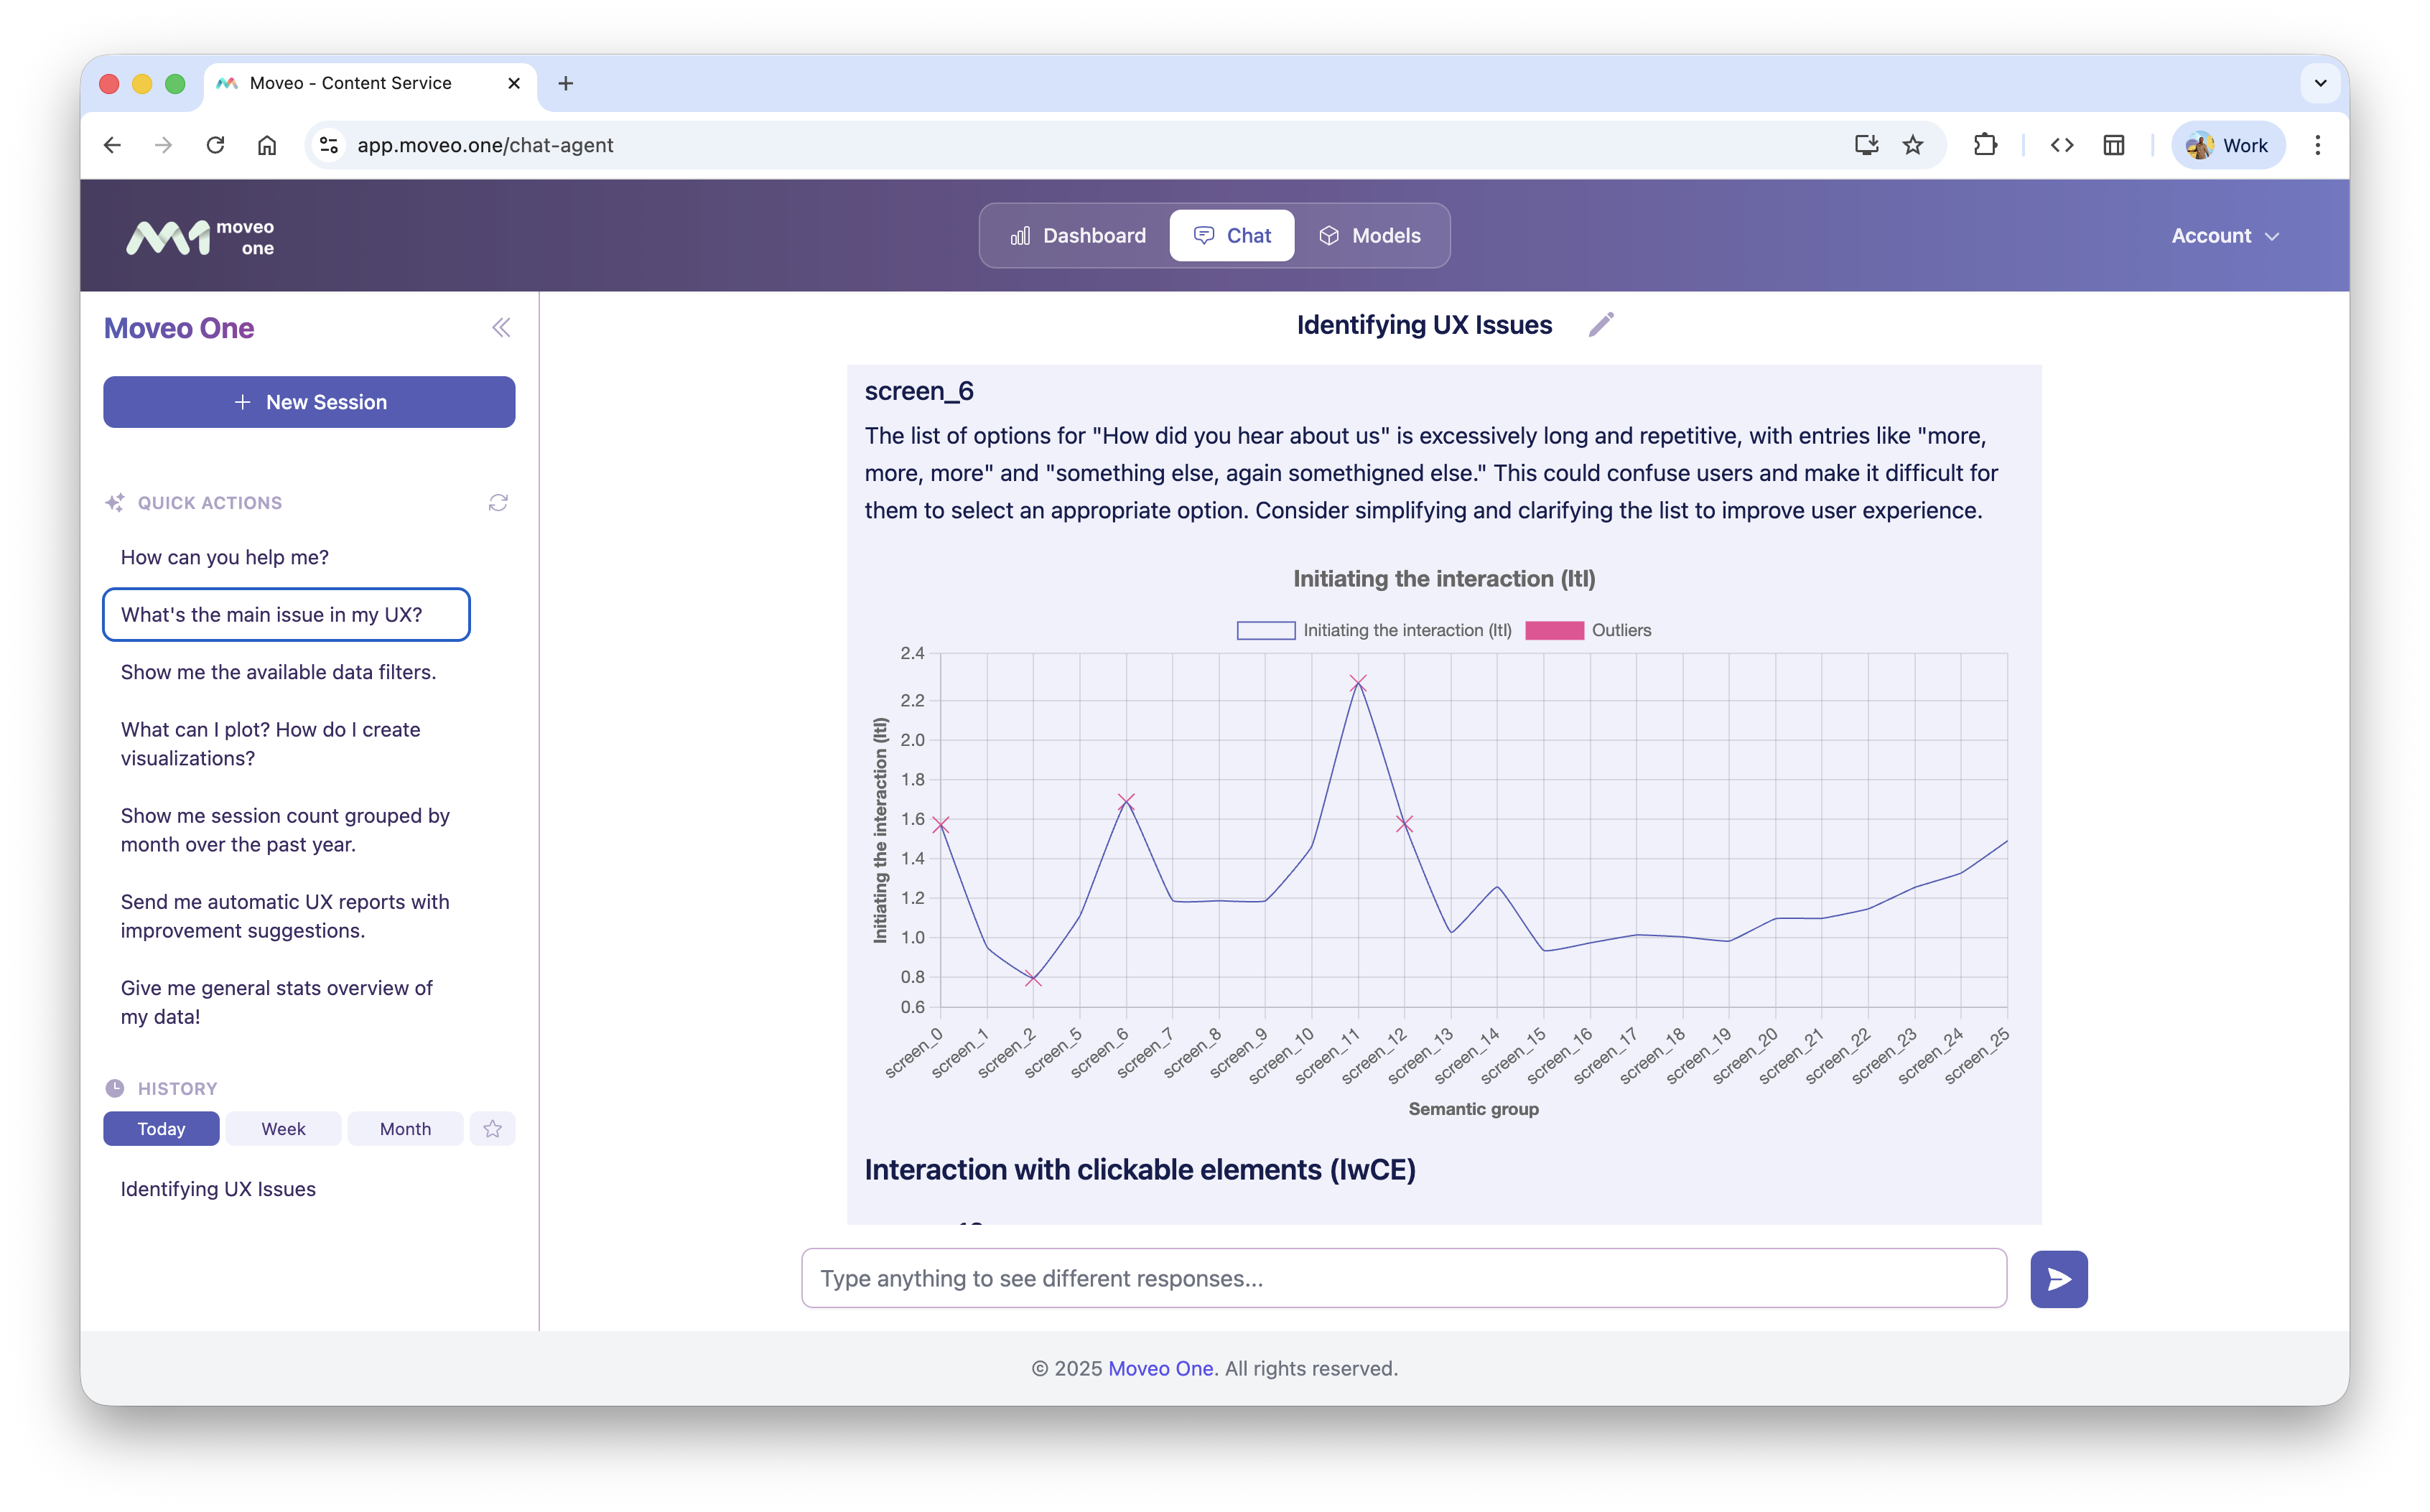
Each insight record contains explanation regarding:
semantic group— the view or feature analyzedmetrics— behavioral indicatorsrecommendation— suggestion on how to improve desired metrics
How Insights Are Generated
-
Event Aggregation:
SDKs continuously collect granular interaction data (clicks, taps, scrolls, gestures). -
Behavioral Modeling:
Time-series and frequency models detect irregularities such as hesitation or repeated inputs. -
Pattern Classification:
AI models classify segments of user behavior into categories like “smooth flow”, “confusion”, or “abandonment”. -
Bottle neck detection:
Based on patterns and UX features that are calculated, we detect outliers that shows which semantic group is diverging of expected pattern. -
Insight Synthesis:
The system generates human-readable summaries and recommendations, available through the chat and/or dashboard.
Dashboard View
In the Moveo One Dashboard → Chat, you can:
- Filter by screen, user segment, or time range
- View visual and flow paths
- Compare insights before and after UX changes
- Export insight summaries as CSV or JSON
All accesible through simply asking the system to do it.
Practical Use Cases
- Detect friction points during onboarding
- Identify high dropout steps in checkout flow
- Compare pre/post redesign performance
- Prioritize A/B test hypotheses using predictive signals
Example Workflow
- Deploy SDK in your production app.
- Collect user interaction data for 24–48h.
- View aggregated insights in the dashboard.
- Adjust UX flow (e.g., button placement, form steps).
- Validate improvement using Predictive Models or Conversion Rate Metrics.